Switzerland Key Figures
- Population:
- 8.77 million
- GDP growth rate:
- 2.06 %/year
- Energy independence:
- 53.2%
Data of the last year available: 2022
- Total consumption/GDP:*
- 64.3 (2005=100)
- CO2 Emissions:
- 3.67 tCO2/capita
- Rate of T&D power losses:
- 7.56%
* at purchasing power parity
View all macro and energy indicators in the Switzerland energy report
Switzerland Related News
View all news, archive your new and create your own daily newsletters only on your topics/countries of interest with Key Energy Intelligence
Switzerland Related Research
Benefit from up to 2 000 up-to-date data series for 186 countries in Global Energy & CO2 data
A data overview is available in the global energy statistics app
Total Energy Consumption
Total energy consumption per capita is 2.6 toe (12.5% lower than the European average in 2022), including 6 540 kWh/cap (18% higher than the European average) (2022).
Total consumption remained stable in 2022 at slightly below 23 Mtoe, following a 3.5%/year decrease over 2019-2021. Previously, it had been increasing slightly (around 1%/year over 2016-2019), after decreasing by 4%/year between 2013 and 2016.
Switzerland has the lowest energy intensity in Europe (behind Ireland and Malta) (2022) (at purchasing power parities).
Interactive Chart Switzerland Total Energy Consumption
Benefit from up to 2 000 up-to-date data series for 186 countries in Global Energy & CO2 data
View the detailed fondamentals of the market at country level (graphs, tables, analysis) in the Switzerland energy report
Crude Oil Production
Of total oil imports, 2/3 are made directly in the form of refined products (5.8 Mt in 2022) and 1/3 in the form of crude oil (3 Mt).
In 2022, 34% of crude oil imports came from Nigeria (-5 pp), 32% from the US, and 14% from Kazakhstan (+9 pp). More than 2/3 of the refined oil products are imported from Germany (+9 pp).
Interactive Chart Switzerland Crude Oil Production
Benefit from up to 2 000 up-to-date data series for 186 countries in Global Energy & CO2 data
Additionally, for more detailed information on refineries, you can request a sample of our EMEA Refineries Dataset
Oil Products Consumption
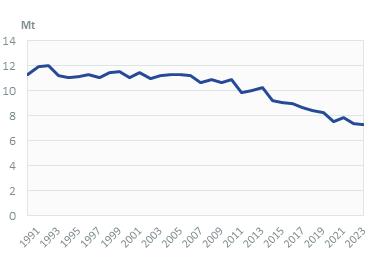
Oil product consumption decreased by 4.8% in 2022 to 7.5 Mt, following a 3.7% rebound in 2021. It shrunk by 4.3%/year, on average, over 2013-2020.
The transport sector accounts for 62% of oil product consumption, followed by buildings (25%, -5 pp).
Graph: OIL CONSUMPTION (MT)
Graph: OIL CONSUMPTION BREAKDOWN BY SECTOR (2022, %)
Interactive Chart Switzerland Refined Oil Products Production
Benefit from up to 2 000 up-to-date data series for 186 countries in Global Energy & CO2 data
Additionally, for more detailed information on refineries, you can request a sample of our EMEA Refineries Dataset
Natural Gas Consumption
Gas consumption is deeply influenced by weather conditions since around two thirds of the consumption are used for heating purposes. It fluctuated around 3.6 bcm over 2010-2020 but increased by 8.6% in 2021 and then plummeted by 18% to 3.15 bcm in 2022, mostly due to a warmer winter and restrictions due to high prices.
Graph: NATURAL GAS CONSUMPTION (bcm)
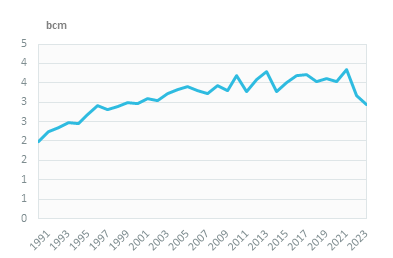
Buildings represent 64% of the gas consumption (2022, +5 points since 2010) and industry 31%.
Interactive Chart Switzerland Natural Gas Domestic Consumption
Benefit from up to 2 000 up-to-date data series for 186 countries in Global Energy & CO2 data
Additionally, for more detailed information on the LNG trade, you can request a sample of our EMEA LNG Trade Dataset
Coal Consumption
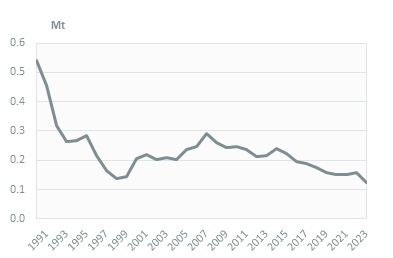
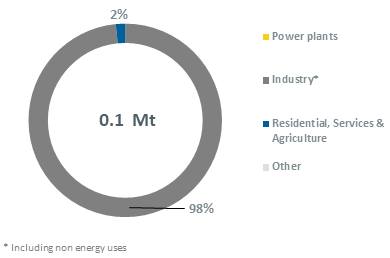
Coal consumption is very low (less than 0.2 Mt) and almost entirely consumed in industry.
Graph: COAL CONSUMPTION (Mt)
Graph: COAL CONSUMPTION BREAKDOWN BY SECTOR (2022, %)
Interactive Chart Switzerland Coal and Lignite Domestic Consumption
Benefit from up to 2 000 up-to-date data series for 186 countries in Global Energy & CO2 data
View the detailed consumption trends at country level (graphs, tables, analysis) in the Switzerland energy report
Power Consumption
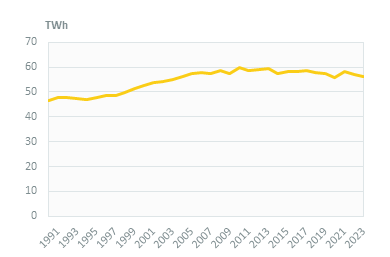
Electricity consumption decreased by 1.4% in 2022 to 57 TWh, driven by rather mild temperatures, improved energy efficiency, and calls to save electricity. Previously, it remained quite stable over 2010-2021 at around 58 TWh (except a 2.6% decrease in 2020 due to Covid-19).
Graph: ELECTRICITY CONSUMPTION (TWh)
The residential sector is the largest electricity consumer (34%); it is followed by industry and services (30% and 28%, respectively) (2022).
CO2 Fuel Combustion/CO2 Emissions
In its latest updated NDC (2021), the country set the goal to reduce GHG emissions by at least 50% by 2030 compared to 1990 levels, with an interim reduction of 35% in 2025. In addition, it pledged to reach net zero emissions by 2050. The NDC does not include any information on adaptation measures.