Spain Key Figures
- Population:
- 47.6 million
- GDP growth rate:
- 5.45 %/year
- Energy independence:
- 30.2%
Data of the last year available: 2022
- Total consumption/GDP:*
- 70.5 (2005=100)
- CO2 Emissions:
- 4.70 tCO2/capita
- Rate of T&D power losses:
- 9.77%
* at purchasing power parity
View all macro and energy indicators in the Spain energy report
Spain Related News
View all news, archive your new and create your own daily newsletters only on your topics/countries of interest with Key Energy Intelligence
Spain Related Research
Benefit from up to 2 000 up-to-date data series for 186 countries in Global Energy & CO2 data
A data overview is available in the global energy statistics app
Total Energy Consumption
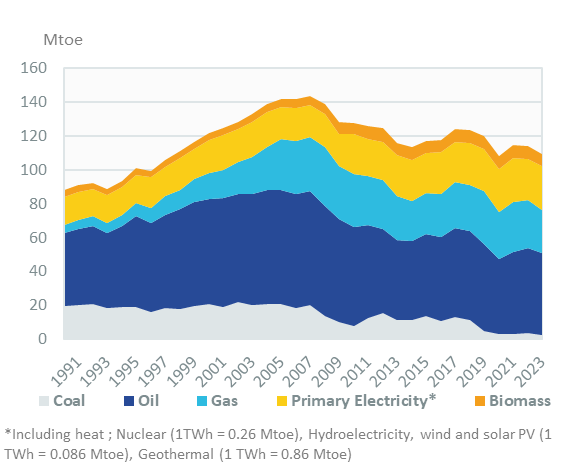
In 2022, total consumption per capita was 2.4 toe (around 18% lower than the EU average for 2022), including 4 900 kWh of electricity (around 12% under the EU average).
Graph: CONSUMPTION TRENDS BY ENERGY SOURCE (Mtoe)
Interactive Chart Spain Total Energy Consumption
Benefit from up to 2 000 up-to-date data series for 186 countries in Global Energy & CO2 data
View the detailed fondamentals of the market at country level (graphs, tables, analysis) in the Spain energy report
Crude Oil Production
Oil production is very low, with no recorded production during 2022 (below 10 kt in 2021). Crude oil imports increased by 8% in 2022 reaching 65.9 Mt. They had increased by 2.7%/year from 2010 to 2018 and fell by 15% in 2020, before increasing again by 4% in 2021. The main suppliers of crude in 2022 were Nigeria (13%), the US and Mexico (10% each), Brazil (8.5%), and Arabia Saudi (7.5%). According to preliminary estimates, crude oil imports decreased by 3.3% in 2023, with the main suppliers being the United States (14%), Mexico (11%), Brazil (11%), and Nigeria (10%).
Interactive Chart Spain Crude Oil Production
Benefit from up to 2 000 up-to-date data series for 186 countries in Global Energy & CO2 data
Additionally, for more detailed information on refineries, you can request a sample of our EMEA Refineries Dataset
Oil Products Consumption
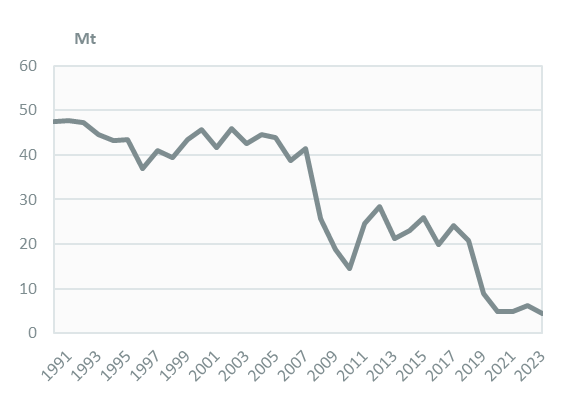
Oil product consumption rose by 4.5% to 49 Mt in 2022, after a 9% increase in 2021 and a sharp 15% drop in 2020. Previously, it had been recovering since 2014 (+1.8%/year), after a rapid reduction over 2007-2014. According to preliminary estimates, oil product consumption dipped by 1.2% in 2023.
Of total oil consumption, 60% is absorbed by the transport sector, 11% by the residential and services sector, 5% by industry, and 4% by power plants.
Graph: OIL CONSUMPTION (Mt)
Interactive Chart Spain Refined Oil Products Production
Benefit from up to 2 000 up-to-date data series for 186 countries in Global Energy & CO2 data
Additionally, for more detailed information on refineries, you can request a sample of our EMEA Refineries Dataset
Natural Gas Consumption
The country's gas consumption decreased by 3.4% to 32.6 bcm in 2022. It is the consequence of lower industrial demand, which was partly offset by a 24% surge in the power sector. It increased by 6% in 2021 after having dropped by 10% in 2020. According to preliminary estimates, gas consumption fell by 11% in 2023 due to a 28% drop in consumption from the power sector.
Interactive Chart Spain Natural Gas Domestic Consumption
Benefit from up to 2 000 up-to-date data series for 186 countries in Global Energy & CO2 data
Additionally, for more detailed information on the LNG trade, you can request a sample of our EMEA LNG Trade Dataset
Coal Consumption
Coal consumption increased again in 2022 to 6.2 Mt (+25%), after remaining stable in 2021. It had dropped by 76% between 2018 and 2020, from 21 Mt to 5 Mt.
Around half of the coal and lignite is used for power generation (57% in 2022), followed by industry (31%).
Graph: COAL CONSUMPTION (Mt)
Graph: COAL CONSUMPTION BREAKDOWN BY SECTOR (2022, %)
Interactive Chart Spain Coal and Lignite Domestic Consumption
Benefit from up to 2 000 up-to-date data series for 186 countries in Global Energy & CO2 data
View the detailed consumption trends at country level (graphs, tables, analysis) in the Spain energy report
Power Consumption
The country's electricity consumption decreased by 1.4% to 232 TWh in 2022, after a 3.5% increase in 2021 and drops of 6.2% in 2020. Previously, electricity consumption surged between 2000 and 2008 (+3.7%/year), dipped until 2014 (-1.8%/year), and recovered slightly until 2018 (+1.3%/year). According to REE's first estimates, electricity demand declined by 2.3% in 2023.
The share of electricity in final energy consumption increased regularly from 18% in 1990 to 22.5% in 2010 and has remained stable since then (23% in 2022).
Graph: ELECTRICITY CONSUMPTION (TWh)
Renewable in % Electricity Production
The target set in the National Action Plan for Renewable Energies (PANER, 2010) for a share of renewables in final energy consumption of 22.7% in 2020 was missed by 1.5 points, with 21.2% achieved. in 2022, renewable energies covered 9.7% of transport consumption, 51% of electricity consumption, and 20% of heating and cooling consumption.
Interactive Chart Spain Share of Renewables in Electricity Production (incl hydro)
Benefit from up to 2 000 up-to-date data series for 186 countries in Global Energy & CO2 data
Learn more about renewables in the European Battery Market Analysis
CO2 Fuel Combustion/CO2 Emissions
GHG emissions increased by 7% in 2021 to 201 MtCO2eq, after dropping by 16% in 2020. Previously, emissions fell by nearly 5%/year over 2007-2014, recovered until 2017, and then declined again until 2020 (-14% in 2020 alone).
According to the draft updated NECP 2021-2030, Spain aims to reduce its GHG gas emissions by 32% in 2030 compared to 1990 levels (70% emission reduction in ETS sectors and 43% in other sectors). In 2021, the Parliament approved the Law on Climate Change and Energy Transition, which aims for carbon neutrality by 2050.