Poland Key Figures
- Population:
- 37.6 million
- GDP growth rate:
- 4.87 %/year
- Energy independence:
- 57.3%
Data of the last year available: 2022
- Total consumption/GDP:*
- 58.3 (2005=100)
- CO2 Emissions:
- 7.94 tCO2/capita
- Rate of T&D power losses:
- 5.38%
* at purchasing power parity
View all macro and energy indicators in the Poland energy report
Poland Related News
View all news, archive your new and create your own daily newsletters only on your topics/countries of interest with Key Energy Intelligence
Poland Related Research
Benefit from up to 2 000 up-to-date data series for 186 countries in Global Energy & CO2 data
A data overview is available in the global energy statistics app
Total Energy Consumption
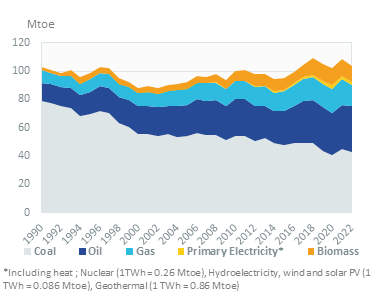
In 2022, total energy consumption per capita was 2.8 toe (around 6% below the EU average), including around 4 100 kWh of electricity (26% below the EU average).
Total energy consumption decreased by 4% in 2022 to 104 Mtoe, after a 6% rebound in 2021. Total energy consumption declined by 4%/year on average between 2018 and 2020. Previously, it increased by 3.7%/year between 2015 and 2018.
Graph: CONSUMPTION TRENDS BY ENERGY SOURCE (Mtoe)
Interactive Chart Poland Total Energy Consumption
Benefit from up to 2 000 up-to-date data series for 186 countries in Global Energy & CO2 data
View the detailed fondamentals of the market at country level (graphs, tables, analysis) in the Poland energy report
Crude Oil Production
Poland's oil production is limited (around 4% of its needs with 1.2 Mt in 2022). In 2022, Poland imported 27.5 Mt of crude oil (+12% compared to 2021). Russia accounted for 43% of crude oil imports in 2022, down from 63% in 2021. Saudi Arabia became the second oil supplier in 2022 (30%), followed by Norway, which more than doubled its market share in 2022 from 5% to 13%.
Interactive Chart Poland Crude Oil Production
Benefit from up to 2 000 up-to-date data series for 186 countries in Global Energy & CO2 data
Additionally, for more detailed information on refineries, you can request a sample of our EMEA Refineries Dataset
Oil Products Consumption
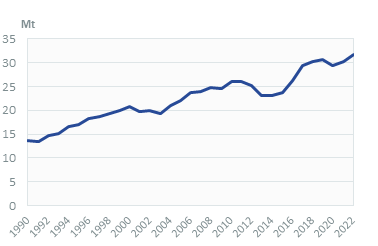
Oil consumption increased by 2.9% in 2022 to 31 Mt, after a rebound of 4% in 2021. Previously, oil consumption had a period of moderate growth between 2017 and 2019 (+1.8%/year), and very rapid growth between 2014 and 2017 (+9.9%/year), thanks to the economic recovery and low oil prices.
Around 70% of oil products are consumed in transport and 15% in industry (including non-energy uses).
Graph: OIL CONSUMPTION (Mt)
Interactive Chart Poland Refined Oil Products Production
Benefit from up to 2 000 up-to-date data series for 186 countries in Global Energy & CO2 data
Additionally, for more detailed information on refineries, you can request a sample of our EMEA Refineries Dataset
Natural Gas Consumption
Gas consumption dropped by 14% in 2022 to 19.7 bcm, due to rising gas prices. It has been increasing very rapidly over 2014-2021 (+3.5%/year). Growth was 2%/year on average between 2000 and 2014.
Graph: NATURAL GAS CONSUMPTION (bcm)
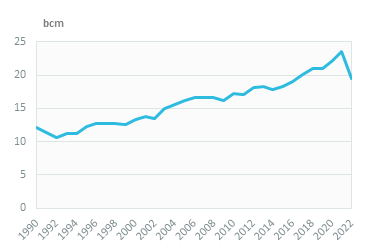
Households, services, and agriculture accounted for 39% of the country's gas consumption in 2022, followed by industry (including non-energy uses) with 35% and power plants dropped with 14% (- 2 points in 2022).
Interactive Chart Poland Natural Gas Domestic Consumption
Benefit from up to 2 000 up-to-date data series for 186 countries in Global Energy & CO2 data
Additionally, for more detailed information on the LNG trade, you can request a sample of our EMEA LNG Trade Dataset
Coal Consumption
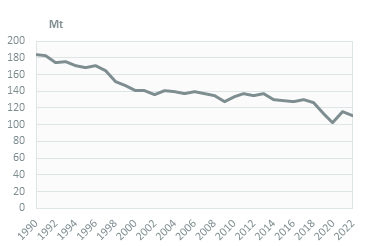
Consumption of coal and lignite decreased by 2% in 2022 to 113 Mt after a 12% rebound in 2021 and an 8.5% decline in 2020. Previously, coal consumption was decreasing slightly (-0.7%/year over 2000-2019).
Coal and lignite are mainly consumed by power plants (82% in 2022). Buildings (residential, services, and agriculture) absorb about 7% of coal consumption; the share of industry is marginal (5.6%).
Graph: COAL CONSUMPTION (Mt)
Interactive Chart Poland Coal and Lignite Domestic Consumption
Benefit from up to 2 000 up-to-date data series for 186 countries in Global Energy & CO2 data
View the detailed consumption trends at country level (graphs, tables, analysis) in the Poland energy report
Power Consumption
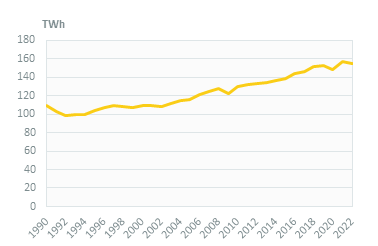
Electricity consumption decreased by 2% in 2022 to 154 TWh, after a 6% rebound in 2021 and a slight decrease in 2020 (-2%). Previously, electricity consumption had grown by 1.8%/year between 2010 and 2019.
Graph: ELECTRICITY CONSUMPTION (TWh)
In 2022, industry consumes 34% of the country's electricity, followed by services with 34%, households with 20%, and transport with 2%.
Graph: ELECTRICITY CONSUMPTION BREAKDOWN BY SECTOR (2022, %)
Renewable in % Electricity Production
The 2020 target of the European Directive on renewables for a 15% share of renewables in the final consumption was not reached (12.9% in 2020). In 2022, this share reached 16.9% (21% for electricity, 22.7% for heating, and 5.8% in transport).
Interactive Chart Poland Share of Renewables in Electricity Production (incl hydro)
Benefit from up to 2 000 up-to-date data series for 186 countries in Global Energy & CO2 data
Learn more about renewables in the European Battery Market Analysis
CO2 Fuel Combustion/CO2 Emissions
GHG emissions (without LULUCF) decreased by 5% in 2022 to 326 MtCO2eq after a rebound by 10% in 2021. They increased by 0.6%/year between 2014 and 2019. In 2022, emissions were 14% below their 1990 level.