Finland Key Figures
- Population:
- 5.56 million
- GDP growth rate:
- 2.08 %/year
- Energy independence:
- 61.3%
Data of the last year available: 2022
- Total consumption/GDP:*
- 78.5 (2005=100)
- CO2 Emissions:
- 6.46 tCO2/capita
- Rate of T&D power losses:
- 3.41%
* at purchasing power parity
View all macro and energy indicators in the Finland energy report
Finland Related News
View all news, archive your new and create your own daily newsletters only on your topics/countries of interest with Key Energy Intelligence
Finland Related Research
Benefit from up to 2 000 up-to-date data series for 186 countries in Global Energy & CO2 data
A data overview is available in the global energy statistics app
Total Energy Consumption
Total energy consumption per capita is twice as high as the EU average, at 5.7 toe in 2022, including over 14 000 kWh of electricity per capita (2.9-fold higher than the EU average). The gap is due to a high share of pulp and paper industry activity.
Graph: CONSUMPTION TRENDS BY ENERGY SOURCE (Mtoe)
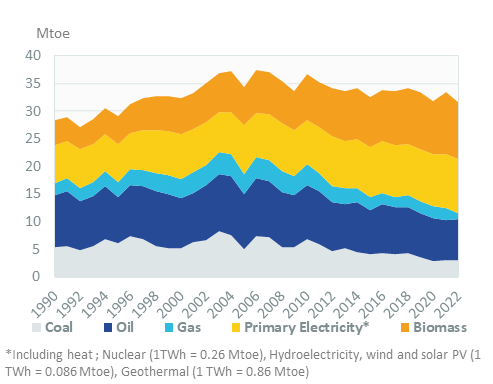
The country's total consumption decreased by 5% in 2022 to 31.7 Mtoe, back to its 2020 level. It had remained stable between 2013 and 2019 at around 34 Mtoe.
Interactive Chart Finland Total Energy Consumption
Benefit from up to 2 000 up-to-date data series for 186 countries in Global Energy & CO2 data
View the detailed fondamentals of the market at country level (graphs, tables, analysis) in the Finland energy report
Crude Oil Production
Oil supplies are primarily ensured by imports, particularly crude oil (over 80%). In 2022, Finland drastically reduced oil imports from Russia (17%), a country from which it used to be primarily dependent (64% of imports in 2021) and quadrupled imports from Norway (65% of imports and 5.7 Mt). Finland is a net exporter of oil products, mainly to Sweden ($1.86bn of refined petroleum) and the United States ($1.28bn)). In April 2022, Finland agreed to release 369 kbl of crude oil from its emergency supply in an attempt to ease prices.
Interactive Chart Finland Crude Oil Production
Benefit from up to 2 000 up-to-date data series for 186 countries in Global Energy & CO2 data
Additionally, for more detailed information on refineries, you can request a sample of our EMEA Refineries Dataset
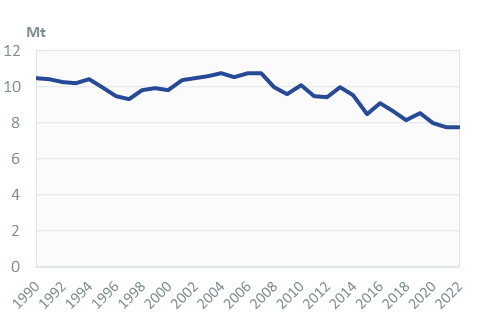
Oil Products Consumption
Oil product consumption decreased by 2% in 2022, reaching 7.5 Mt after a 6% drop in 2020 and a regular decline of around 2%/year since its peak at 10 Mt in 2007 and 2019.
Transport is the largest consuming sector for oil products, although its share is relatively modest (42% in 2022). Industry and non-energy-uses account for 30%, buildings (residential and services) for 12%, and district heating for 13%.
Graph: OIL CONSUMPTION (Mt)
Interactive Chart Finland Refined Oil Products Production
Benefit from up to 2 000 up-to-date data series for 186 countries in Global Energy & CO2 data
Additionally, for more detailed information on refineries, you can request a sample of our EMEA Refineries Dataset
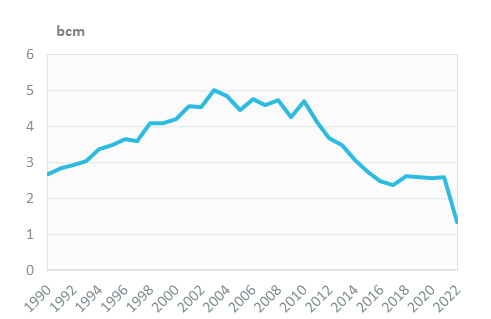
Natural Gas Consumption
In 2022, gas consumption dropped by 48% to 1.3 bcm. Gas consumption has remained stable at around 2.6 bcm since 2018. Previously, it had declined very rapidly (9%/year) between 2011 and 2017 to 2.3 bcm.
Industry accounted for 54% of the gas consumption in 2022, followed by power plants (16%) and buildings (4%).
Graph: NATURAL GAS CONSUMPTION (bcm)
Graph: GAS CONSUMPTION BREAKDOWN BY SECTOR (2022, %)
Interactive Chart Finland Natural Gas Domestic Consumption
Benefit from up to 2 000 up-to-date data series for 186 countries in Global Energy & CO2 data
Additionally, for more detailed information on the LNG trade, you can request a sample of our EMEA LNG Trade Dataset
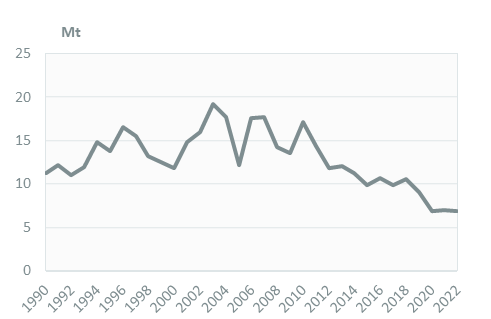
Coal Consumption
Coal and peat consumption, which had remained roughly stable between 2015 and 2018, fell by 15% in 2019 and 23% in 2020 and remained stable in 2021 and 2022 at around 7 Mt (of which, 60% peat), due to lower demand from the power sector.
The power sector is the main consumer of coal and peat, with 62% of total consumption in 2022 (of which, 40% peat), followed by industry (18%).
Graph: COAL CONSUMPTION (Mt)
Interactive Chart Finland Coal and Lignite Domestic Consumption
Benefit from up to 2 000 up-to-date data series for 186 countries in Global Energy & CO2 data
View the detailed consumption trends at country level (graphs, tables, analysis) in the Finland energy report
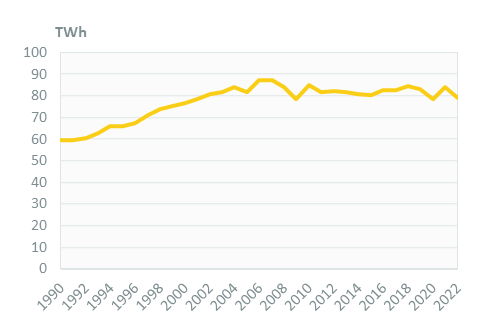
Power Consumption
Electricity consumption decreased by 6% in 2022 to 79 TWh after a6.8% increase in 2021. It decreased by 2% in 2023. It already declined in 2019 and 2020 it (-1.7% in 2019 and -5.4% in 2020) after a progression of 1.8%/year between 2015 and 2018.
The share of industry in electricity consumption was 44% in 2022, compared to 29% for the residential sector and 22% for services.
Graph: ELECTRICITY CONSUMPTION (TWh)
Renewable in % Electricity Production
Motiva is also in charge of renewables.
According to Finland's NECP, renewables are expected to account for at least 51% of the country's final energy consumption in 2030 (of which 30% for transport), compared to 42% in 2022 (of which 40% for electricity, 53% for heating, and 20.5% in transport). The share of renewables reached 47.9% in 2022 (of which 47.9% for electricity, 58.6% for heating, and 18.8% in transport). The share of renewables in transport is the second highest in the EU, behind Sweden with 29% in 2022.
Interactive Chart Finland Share of Renewables in Electricity Production (incl hydro)
Benefit from up to 2 000 up-to-date data series for 186 countries in Global Energy & CO2 data
Learn more about renewables in the European Battery Market Analysis
CO2 Fuel Combustion/CO2 Emissions
Total GHG emissions have decreased by 4.5%/year on average since 2010, reaching 48 MtCO2eq in 2021.