Belgium Key Figures
- Population:
- 11.9 million
- GDP growth rate:
- 1.00 %/year
- Energy independence:
- 28.0%
Data of the last year available: 2024
- Total consumption/GDP:*
- 62.9 (2005=100)
- CO2 Emissions:
- 6.07 tCO2/capita
- Rate of T&D power losses:
- 4.55%
* at purchasing power parity
View all macro and energy indicators in the Belgium energy report
Belgium Energy News
View all news, archive your new and create your own daily newsletters only on your topics/countries of interest with Key Energy Intelligence
Belgium Energy Research
Benefit from up to 2 000 up-to-date data series for 186 countries in Global Energy & CO2 data
A data overview is available in the global energy statistics app
Belgium Total Energy Consumption
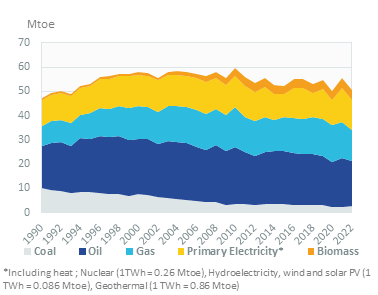
Total energy consumption per capita is 43% higher than the EU average, at 4.0 toe in 2023. Electricity consumption per capita is 16% above the EU average and amounted to around 6 200 kWh in 2023.
Graph: CONSUMPTION TRENDS BY ENERGY SOURCE (Mtoe)
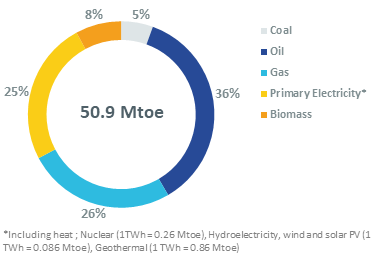
Graph: TOTAL CONSUMPTION MARKET SHARE BY ENERGY (2024, %)
Interactive Chart Belgium Total Energy Consumption
Benefit from up to 2 000 up-to-date data series for 186 countries in Global Energy & CO2 data
View the detailed fondamentals of the market at country level (graphs, tables, analysis) in the Belgium energy report
Belgium Crude Oil Production
All the oil is imported (57 Mt in 2024). Crude oil accounts for around 58% of oil imports. In 2024, 21% of crude oil was imported from OPEP countries, Norway (18%), the US (18%), the UK (6%), and Kazakhstan (12%).
There are four refineries, all located in Anvers, with a total capacity of (837 kb/d). The refineries are focused on diesel production (around half of total production).
Interactive Chart Belgium Crude Oil Production
Benefit from up to 2 000 up-to-date data series for 186 countries in Global Energy & CO2 data
Additionally, for more detailed information on refineries, you can request a sample of our EMEA Refineries Dataset
Belgium Oil Products Consumption
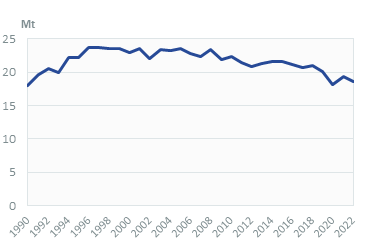
Oil consumption increased by 3.4% to 18.4 Mt in 2024 after a 5% decrease in 2022. It experienced a 10% drop in 2020 amid the Covid pandemic. Previously, oil consumption declined by 1.2%/year over 2015-2019.
Graph: OIL CONSUMPTION (Mt)
In 2024, transport represented 41% of oil consumption, industry (including non-energy uses) 34%, and residential, services & agriculture 14%.
Graph: OIL CONSUMPTION BREAKDOWN BY SECTOR (2024, %)
Interactive Chart Belgium Refined Oil Products Production
Benefit from up to 2 000 up-to-date data series for 186 countries in Global Energy & CO2 data
Additionally, for more detailed information on refineries, you can request a sample of our EMEA Refineries Dataset
Belgium Natural Gas Consumption
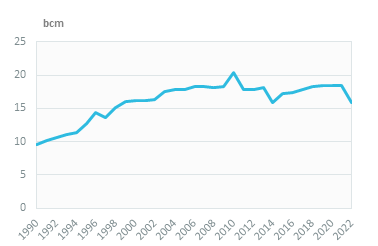
Gas consumption continued its decrease in 2024 (-4%) to 14.1 bcm after a 14% drop in 2022 (-9%/year on average over 2021-24). It had increased by 1.2%/year on average between 2015 and 2021.
Graph: NATURAL GAS CONSUMPTION (bcm)
Buildings (residential and services sector) accounted for 40% of total gas consumption; the remaining amount is mainly consumed in industry (37%) and in electricity production (17%) (2024).
Interactive Chart Belgium Natural Gas Domestic Consumption
Benefit from up to 2 000 up-to-date data series for 186 countries in Global Energy & CO2 data
Additionally, for more detailed information on the LNG trade, you can request a sample of our EMEA LNG Trade Dataset
Belgium Coal Consumption
Coal consumption started a downward trend in 1990; it decreased by 3.5%/year over 2010-2023 and slightly increased in 2024 to 3.8 Mt.
Graph: COAL CONSUMPTION (Mt)
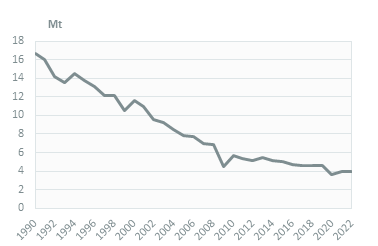
Industry is the main coal consumer, with a share of 83% (42% in 2009), followed by power plants with 16%, compared to 44% in 2009.
Graph: COAL CONSUMPTION BREAKDOWN BY SECTOR (2024, %)
Interactive Chart Belgium Coal and Lignite Domestic Consumption
Benefit from up to 2 000 up-to-date data series for 186 countries in Global Energy & CO2 data
View the detailed consumption trends at country level (graphs, tables, analysis) in the Belgium energy report
Belgium Power Consumption
In 2024, electricity consumption increased by 3%, for the first time since 2021, reaching 78 TWh. It remained roughly stable between 2010 and 2018, at around 83 TWh/year, and decreased by 1.6%/year until 2020.
Graph: ELECTRICITY CONSUMPTION (TWh)
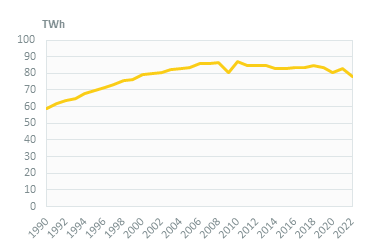
The industrial sector accounts for 45% of the country's electricity consumption, compared to 27% for services and 21% for the residential sector (2024).
Graph: ELECTRICITY CONSUMPTION BREAKDOWN BY SECTOR (2024, %)
Belgium Renewable in % Electricity Production
The target set in the NECP is 21.7% for 2030. In 2023, the share of renewables in final consumption was 14.7%, of which, 31% was for electricity, 11.3% for heating, and 10.4% for transport.
Belgium was 1 point short of its 2020 target.
Interactive Chart Belgium Share of Renewables in Electricity Production (incl hydro)
Benefit from up to 2 000 up-to-date data series for 186 countries in Global Energy & CO2 data
Learn more about renewables in the European Battery Market Analysis
Belgium CO2 Fuel Combustion/CO2 Emissions
In 2023, GHG emissions (excl. LULUCF) decreased by 4% to 98 MtCO2eq which is 30% below their 1990 level (110 MtCO2eq in 2021). They remained stable between 2015 and 2021 and decreased by 6% in 2022.
The policies to fight Climate Change are defined at the federal level, while the implementation is split between the State and the regions: each region has its own climate plan and target. The National Climate Commission (NCC) controls the implementation of the National Climate Plan.